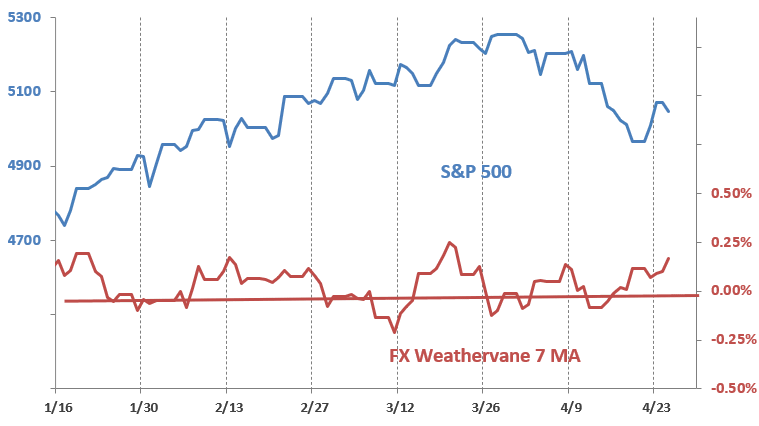
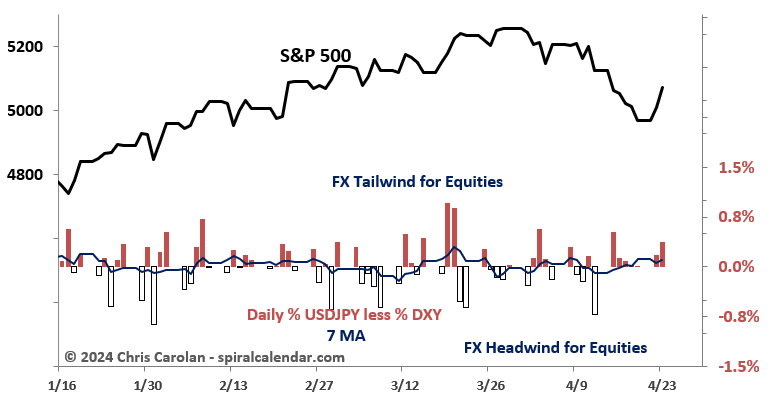
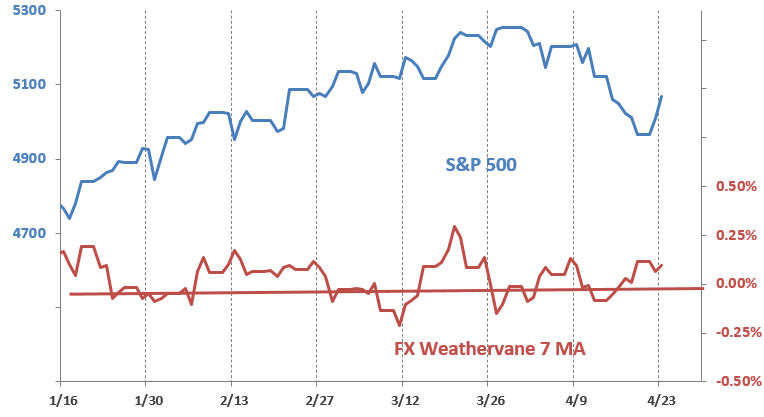
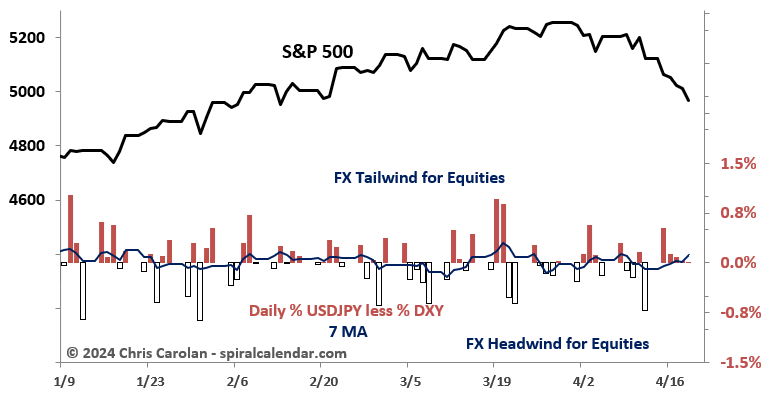
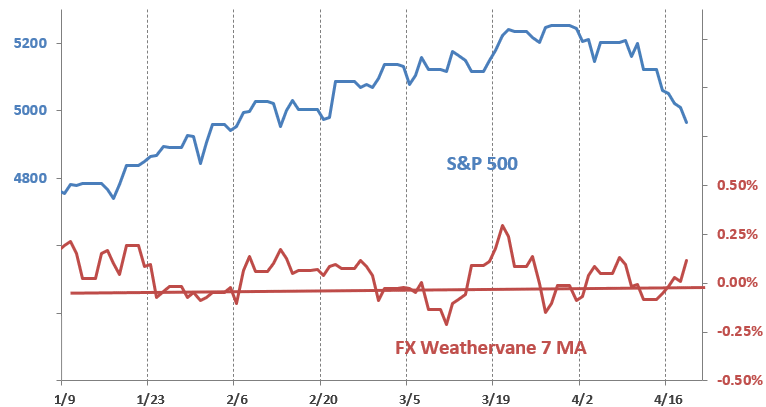
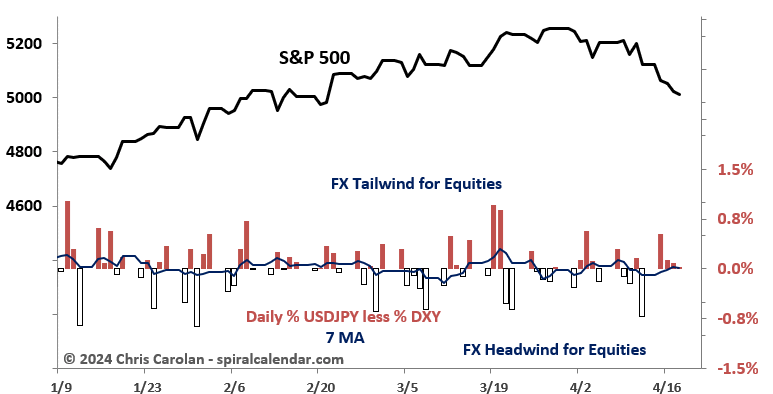
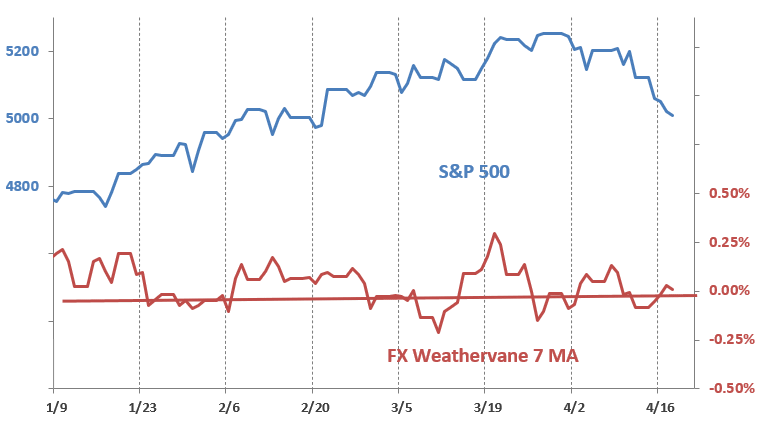
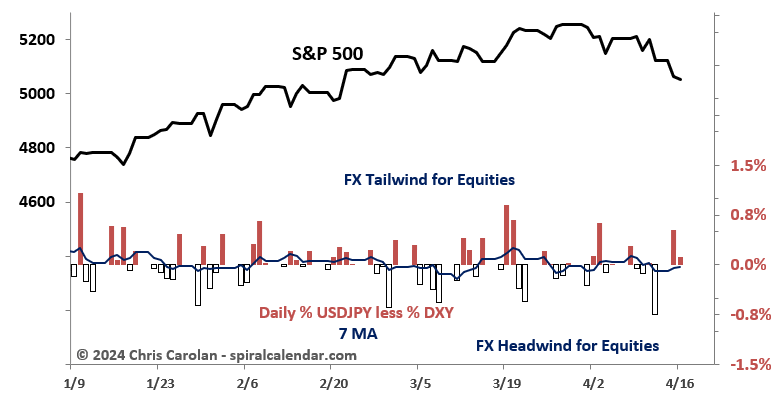
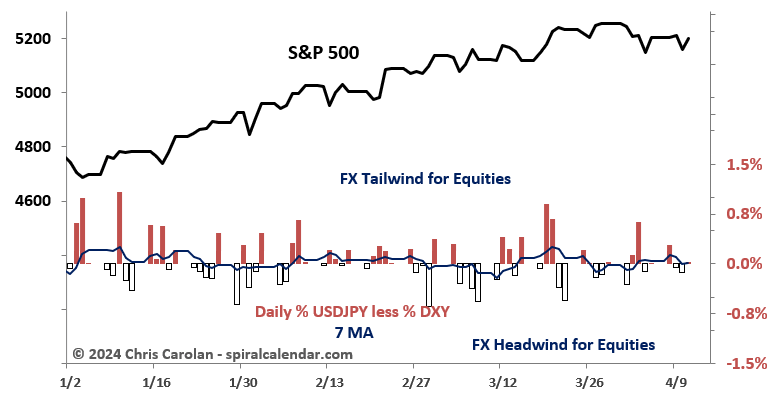
FX liquidity is abundant - discussion inside.
click chart to enlarge
click chart to enlarge
click chart to enlarge
click chart to enlarge
click chart to enlarge
click chart to enlarge
click chart to enlarge
click chart to enlarge
click chart to enlarge
click chart to enlarge
click chart to enlarge
click chart to enlarge
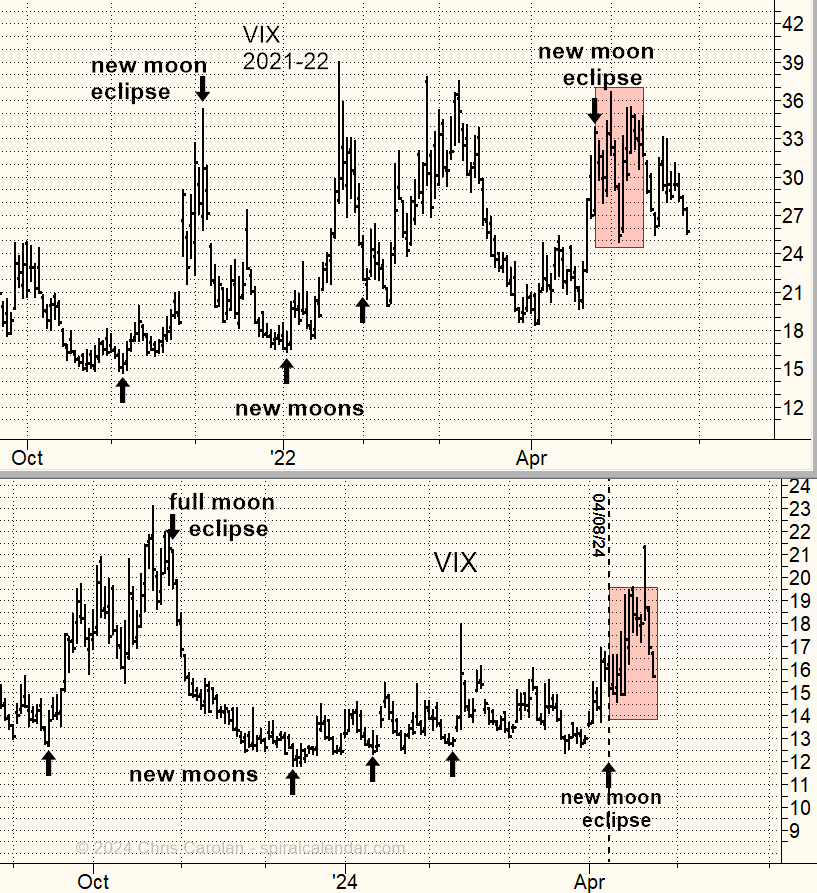
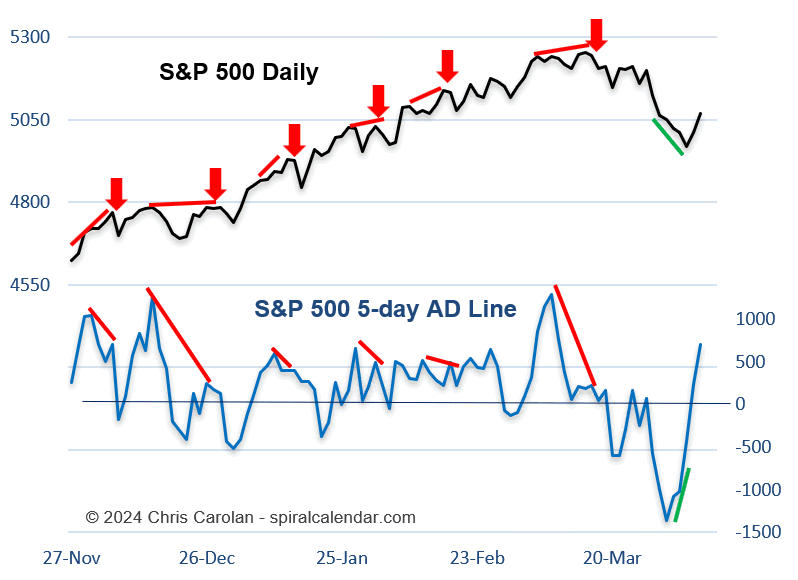
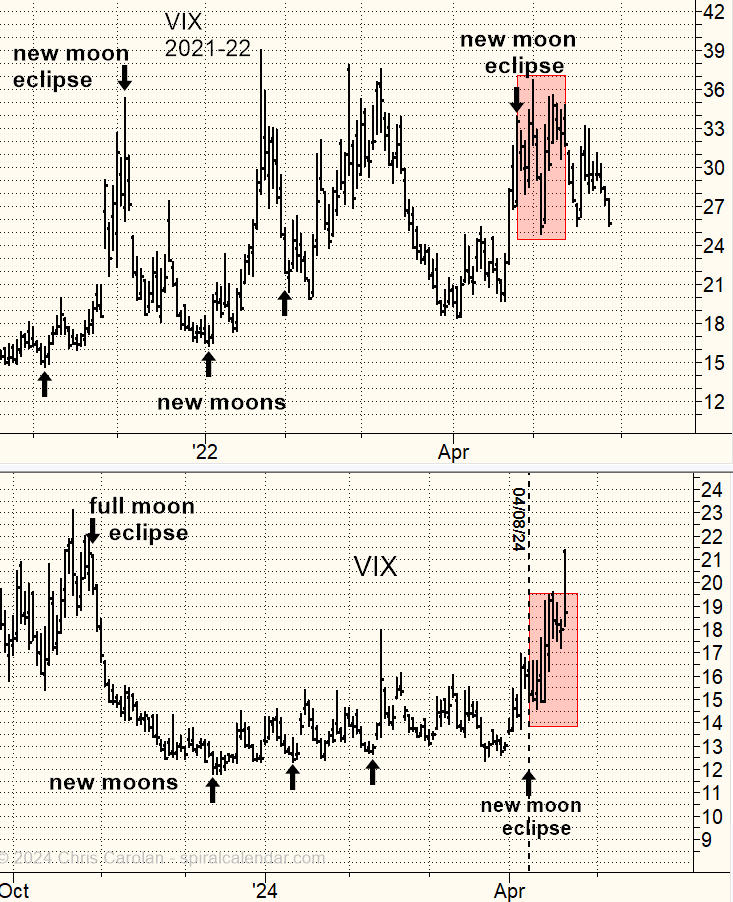
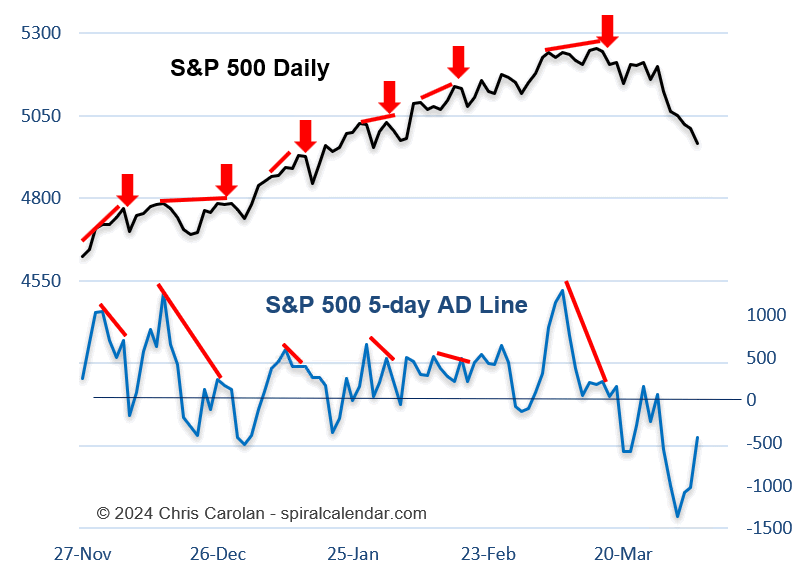
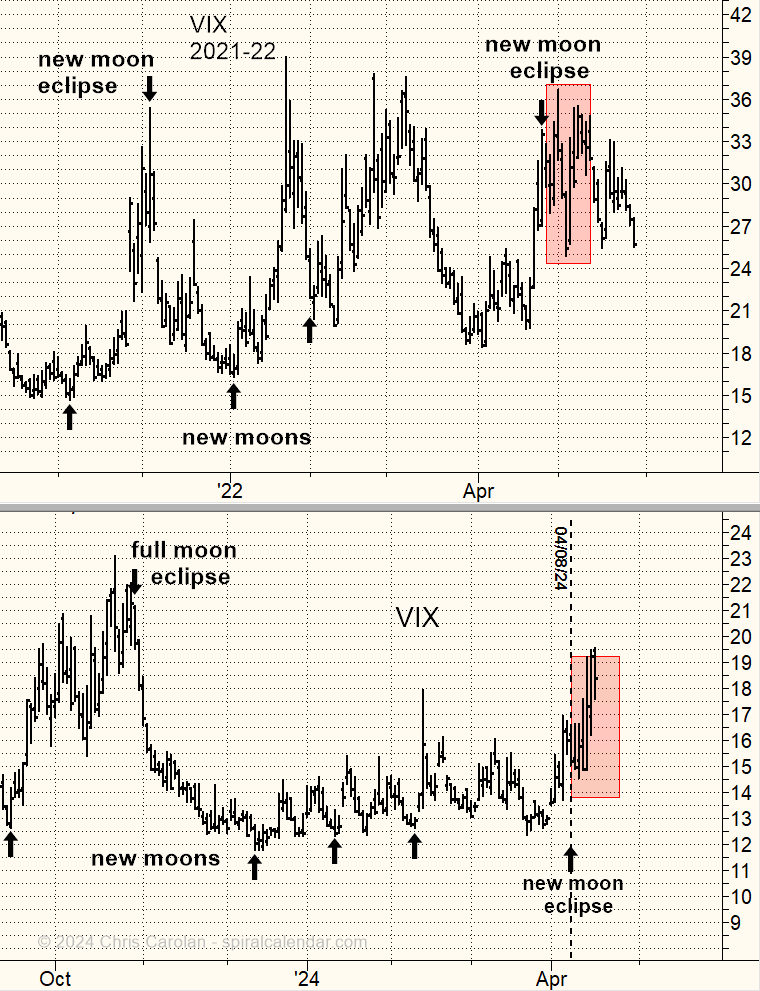
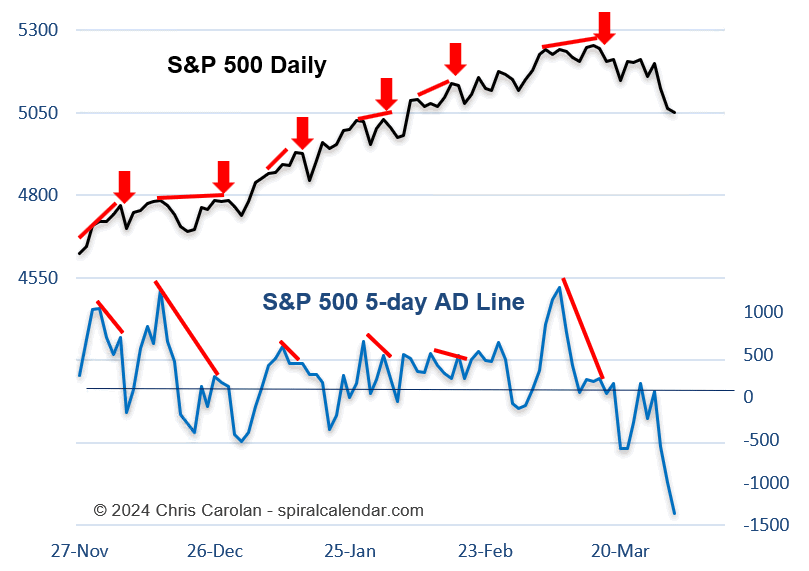
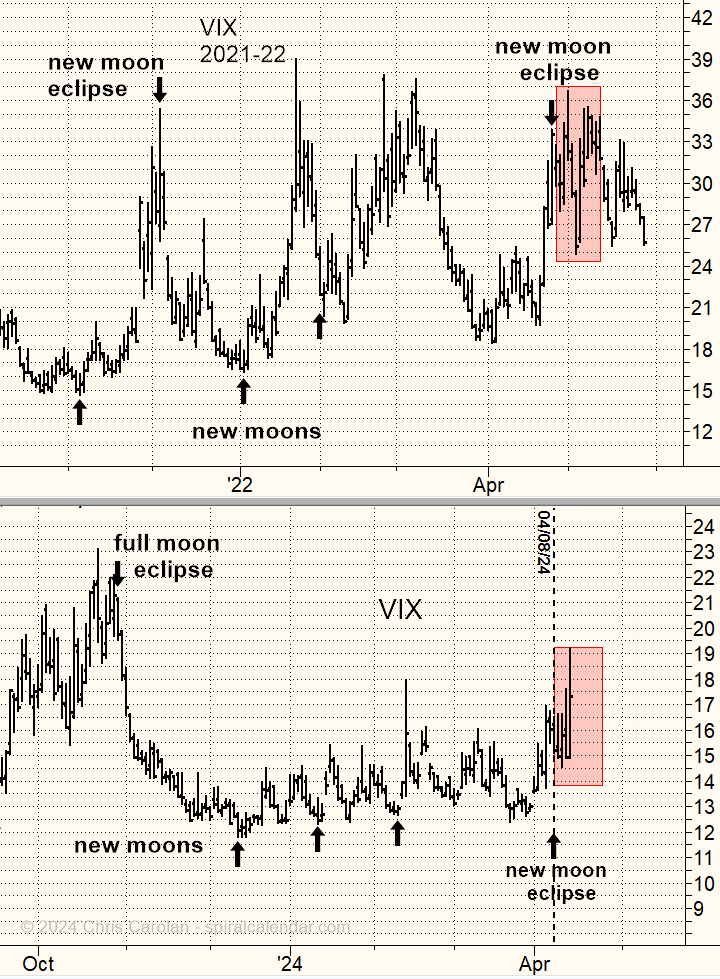
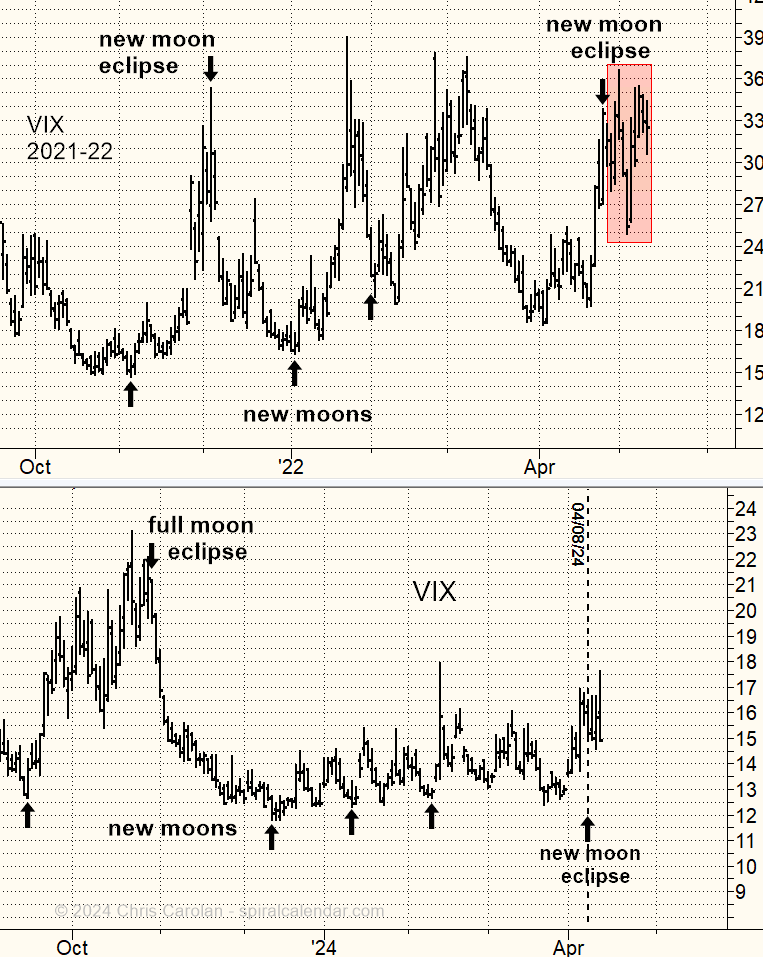
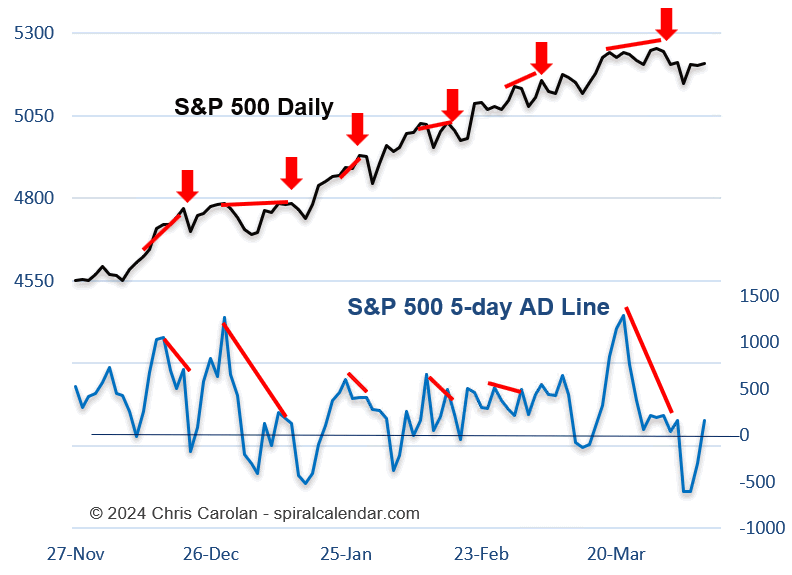
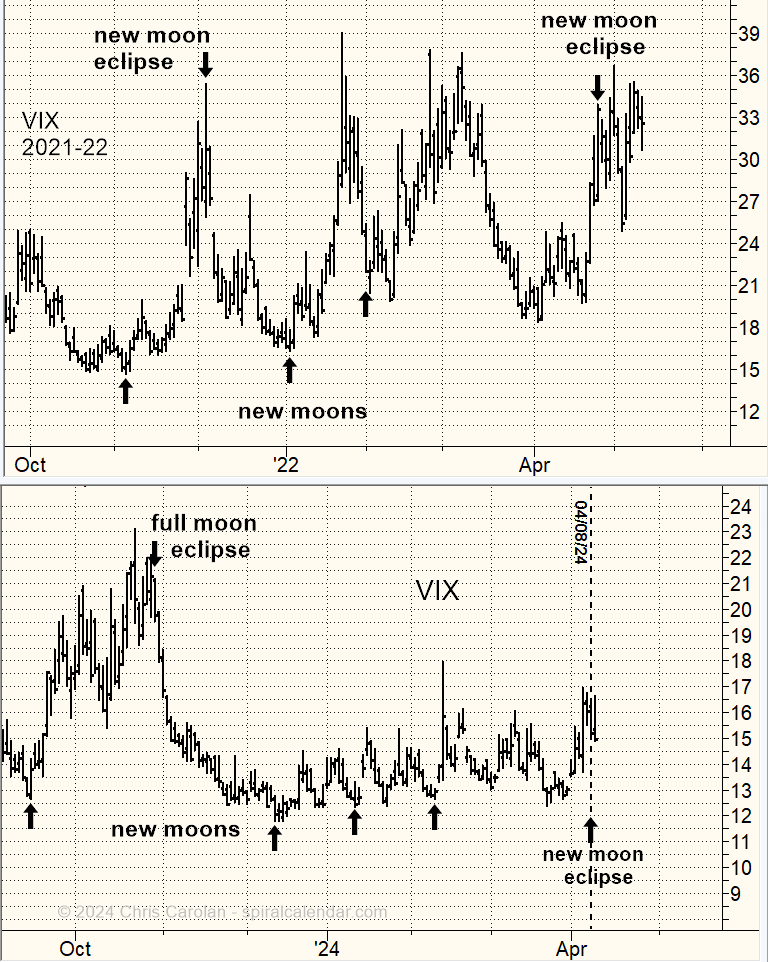
Should be another exciting week. The tides should give us an assist. Discussion inside.
click chart to enlarge
click chart to enlarge
click chart to enlarge
click chart to enlarge
click chart to enlarge
click chart to enlarge
click chart to enlarge
click chart to enlarge
click chart to enlarge
click chart to enlarge
click chart to enlarge

click chart to enlarge
Click chart to enlarge
Click chart to enlarge
Click chart to enlarge
Click chart to enlarge
click chart to enlarge
click chart to enlarge

click chart to enlarge
click chart to enlarge
click chart to enlarge
click chart to enlarge
click chart to enlarge
click chart to enlarge